Sensor Data Visualization Components and Controls
The Visualization and Control Components
The visualization gauges are designed to instantly represent a live data stream visually, once the UDP source, sensor and data value is specified for the component.
Once a component is placed on the screen by dragging and dropping the icon onto the workspace, double click or right click on the component to bring up the component properties dialog box. It is the properties dialog box that provides for setting and modification of data source specifics, and other visual parameters.
The "control" components (different from the "visualization" components) are used to pass commands and information to an external or local system via the target IP address and port. Just as with the visualization components, a connection is made by RealTime to an external system, but in this case the selection is made with respect to a UDP Target, not UDP Source. A target system does NOT have to be the originating source system of the sensor data, although in many cases they may be the same. An example might be a flight simulation module where the sensor data is coming from avionics sensors, and the commands are going to the avionics systems actuators (virtual or otherwise). A connection with a system is made by double clicking on or right clicking on the control component once added to the screen, and selecting the UDP Target, the Command and other specific information provided.
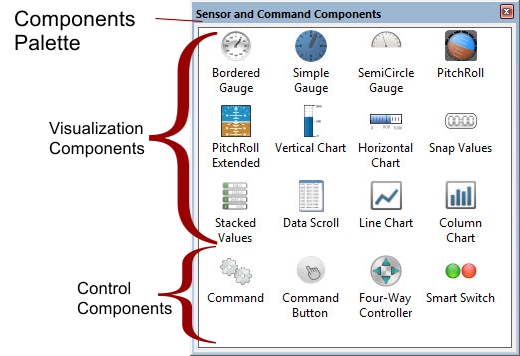
Brief Descriptions of Each Component:
Bordered Gauge: Fully customizable circular gauge including multiple borders, background colors and scales.
Simple Gauge: Circular gauge with more flat simplistic look. Does not have multiple 3D borders, but same scaling options as the bordered circular gauge..
Semicircular Gauge: Similar to the Simple gauge above, but display and scaling for only the upper half of the circle.
Pitch Roll Gauge: Standard avionics gauge that includes combined visualization of the 3 primary attitude sensors - pitch, yaw and roll.
Pitch Roll Extended Gauge: Extended avionics gauge that includes the three primary attitude sensor values (pitch, yaw and roll) along with the magnetic heading and the speed and altitude.
Vertical Chart: Simple one column vertical chart. Fixed sizing.
Horizontal Chart: Simple one row horizontal chart.
Snap Value: Convenient non graphical displays of the sensor data value itself. Move these components near each other to instantly snap together in any convenient formation. Remove any individual element by holding the shift button while you click on the component for removing.
Stacked Values: A convenient component for instant display of all data members of an individual sensor. Simply specify the UDP Source and the Sensor. The stacked values component automatically adds as many single row data items for display as the sensor provides. For instance, the accelerometer would provide 5 - the sample number, the time, and the x, y and z values.
Data Scroll: A convenient and quick way to display all data arriving from the associated sensor. As data comes in from the sensor it is displayed by inserting at top of stack. There are approximately 25 rows of data that will continue to scroll as data arrives. This is useful to get a feel for speed and structure of data on arrival.
Line Chart: Linear, fully customizable horizontally scrolling chart. Add as many sensor data members as desired and set the scaling. Click and hold corners for resizing to any size on screen. Set legend, title and scaling parameters.
Column Chart: Fully customizable vertical column chart. Choose UDP Source and sensor, and then specify the desired data elements for display. Customize color, scaling, title and width of columns. Click and hold corners for resizing to any size on screen.
Command: Use this component to receive data from AI Builder Pro and optionally, forward a pre-selected command on to the target system for control. The command will be sent any time the incoming value from AI Builder Pro is non-zero.
Command Button: Use this component when ou want to have manual control over a command to be sent to your target system. Use the properties dialog box to specify the UDP Target system, the command and any other detail necessary.
4-Way Controller: Works much like a 4 way joystick, where clicks of the mouse on the directional arrows send the command that is associated with the button to the target system.
Smart Switch: A button that utilizes sensor information to display its status, along with the ability to send a command to a target system. This command is triggered when the incoming value from AI builder Pro is non-zero..
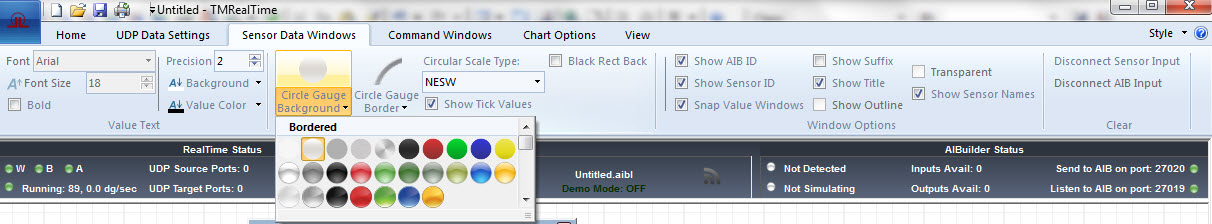
Customizing the Appearance of Components
... coming soon